

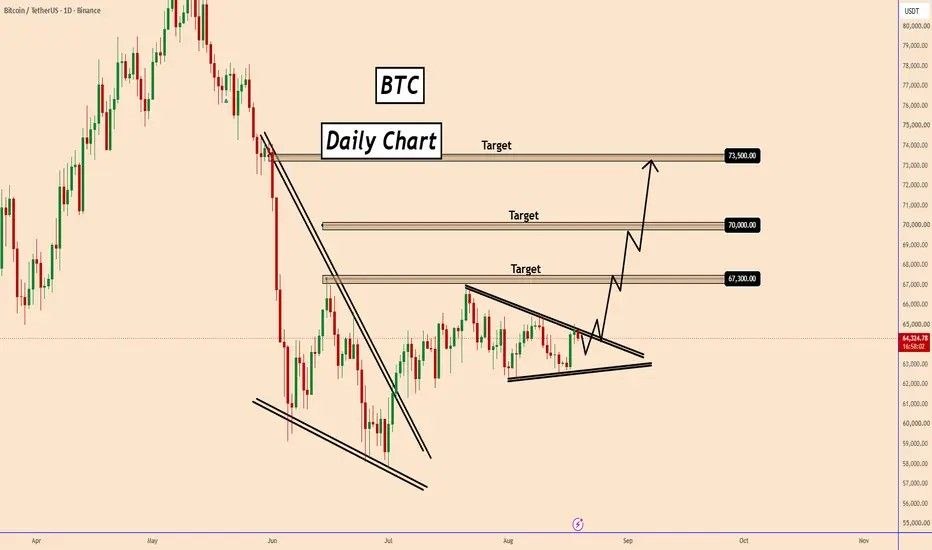
Bitcoin was previously consolidating inside a contracting triangle structure on the daily chart, with price compressing between a descending resistance trendline and rising support.
After a sharp correction from the highs, BTC stabilized around the $62,000–$65,000 zone, suggesting that selling pressure was beginning to lose momentum. The key technical scenario was a potential breakout above the triangle resistance, which could signal a continuation of the bullish move.
📈 Bullish Breakout Scenario
A successful breakout above the contracting structure could open the way toward higher resistance levels. The key upside targets identified were:
- Target 1: $67,300
- Target 2: $70,000
- Target 3: $73,500
🎯 Trade Update: Target Reached
Bitcoin delivered a strong and explosive upside move, successfully reaching the $70,000 target. The breakout from the consolidation structure resulted in significant bullish momentum and confirmed the importance of waiting for price to break out of major technical patterns.
The move was particularly strong, with Bitcoin gaining approximately 10%, while Ethereum experienced an even larger move of around 23%.
⚡ What Caused the Explosive Move?
The strength and speed of the move attracted significant attention. Major cryptocurrency instruments began showing strong momentum around the same period, while market participants were also watching developments and news related to the United States.
However, it is important to avoid making unverified conclusions about the exact cause of the move. Large price movements in cryptocurrency markets can result from several factors, including:
- Major economic or political news
- Institutional buying or selling
- Short liquidations and short squeezes
- Large derivative market activity
- Changes in risk sentiment
- High-volume algorithmic trading
- Speculation and market positioning
The fact that markets may begin moving before a widely reported news event does not, by itself, prove insider trading or any specific individual or organization benefiting from privileged information.
📊 Technical Lesson from This Move
This example highlights the importance of identifying periods of price compression. When price consolidates between descending resistance and rising support, volatility can increase significantly once the market finally breaks out of the structure.
Rather than predicting the direction with certainty, traders can monitor:
- Triangle resistance and support levels
- Breakout confirmation
- Trading volume and momentum
- Key resistance targets
- Market news and economic events
- Risk management and position sizing
The key lesson: Price compression can lead to expansion. However, confirmation and risk management are essential because breakouts can also fail.
🔮 What to Watch Next
With Bitcoin reaching the $70,000 level, traders can now monitor whether price is able to sustain above this important psychological area.
A strong hold above the breakout zone could keep the bullish momentum active and bring the next resistance area around $73,500 into focus. On the other hand, a sharp rejection and move back below the breakout structure could indicate profit-taking or a deeper correction.
⚠️ Risk Disclaimer
This analysis is provided for educational and informational purposes only. It is not financial or investment advice and should not be considered a guarantee of future price movement. Cryptocurrency markets are highly volatile. Always conduct your own analysis, follow your own trading strategy, and use appropriate risk management before entering any trade.
Do your own analysis and trade responsibly. 🍀
Comments (0)
No comments yet. Be the first to comment.