

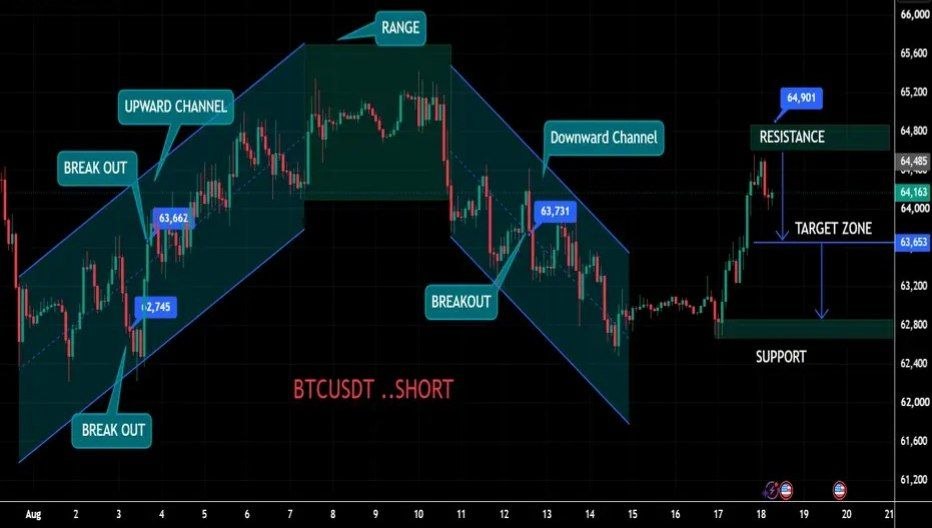
Bitcoin (BTC/USD) is showing a strong recovery after breaking out of the downward channel. Price is currently trading around 64,135, with the chart highlighting 64,901 as the key resistance level.
📈 Bullish Breakout Scenario
A successful breakout and sustained move above 64,901 could strengthen the bullish structure and open the way for further upward momentum.
Traders should wait for a confirmed breakout above resistance before expecting a continuation move. A strong candle close above this level could provide additional confirmation that buyers are regaining control.
📉 Pullback Scenario
If Bitcoin fails to break above 64,901 and faces rejection, price could move back toward the 63,653–63,700 area, which acts as an important short-term target and support zone.
A deeper correction could expose the 62,800 support level. Holding this area would be important for maintaining the broader recovery structure.
📌 Key Levels
- 🔴 Resistance: 64,901
- 🟡 Target / Support Zone: 63,653–63,700
- 🟢 Major Support: 62,800
💡 Market View
Bitcoin remains constructive after breaking out of the downward channel. The key level to watch is 64,901. A confirmed break above this resistance could support further bullish continuation, while rejection may trigger a pullback toward 63,653–63,700.
Market View: BTC/USD is showing recovery momentum, but buyers need to overcome 64,901 for stronger bullish confirmation. Until then, traders should monitor the breakout level and nearby support carefully.
⚠️ Risk Warning: Cryptocurrency markets are highly volatile and technical analysis does not guarantee future price movements. Traders should wait for confirmation and use appropriate risk management before entering a position.
Comments (0)
No comments yet. Be the first to comment.