

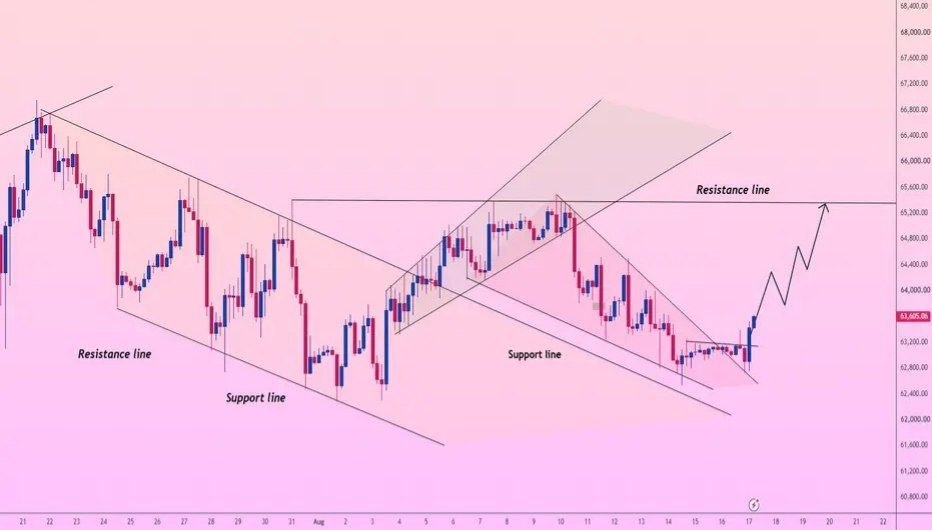
Bitcoin (BTC/USD) is holding firmly above the local breakout support around 63,577.69, showing signs of a structural recovery on the 4-hour timeframe. Price has broken upward from a local descending channel, indicating that buyers are attempting to regain short-term control.
📈 Potential Multi-Wave Rally
The current technical structure suggests a potential multi-wave stair-step expansion toward the major horizontal resistance near 65,300.
- Wave 1: An initial impulse could drive price toward the 64,300 region.
- Wave 2: A healthy higher-low retest toward approximately 63,900 could allow the broken trendline resistance to act as new support.
- Wave 3: A secondary expansion wave could push BTC toward 64,800.
- Wave 4: A minor consolidation move toward 64,200 could establish another structural buying base.
- Wave 5: A final acceleration could drive price toward the overhead horizontal resistance near 65,300.
🧘 Trading Discipline
Technical patience and trendline alignment remain important in this setup. Shorting directly into a confirmed structural breakout can expose traders to the risk of a strong continuation move.
Traders may instead wait for pullbacks and confirmation around key support areas before considering bullish setups. Maintaining the breakout structure would strengthen the recovery scenario.
🛠 Trade Parameters
- 🛒 Long Zone: 63,200–63,600
- 🛑 Stop-Loss Reference: 4H close below 62,600
- 💰 Take-Profit: 65,300
📌 Key Levels
- Local Breakout Support: 63,577.69
- First Upside Target: 64,300
- Second Upside Target: 64,800
- Major Resistance / Target: 65,300
- Major Invalidation Area: 62,600
⚠️ Market View
BTC/USD remains constructive while price holds above the breakout structure and key support zone. A successful continuation above 64,300 could open the way toward 64,800 and potentially the major 65,300 resistance.
However, a sustained move below 62,600 would weaken the current bullish setup and could signal that the breakout has failed.
Market View: Bitcoin is showing a bullish recovery structure above the local breakout support. Traders should monitor 63,200–63,600 for support and 65,300 as the key upside resistance target.
⚠️ Risk Warning: This analysis represents a technical market scenario and does not guarantee future price movements. Cryptocurrency markets are highly volatile and can move rapidly in either direction. Always use appropriate risk management and consider market conditions before entering a trade.
Comments (0)
No comments yet. Be the first to comment.