

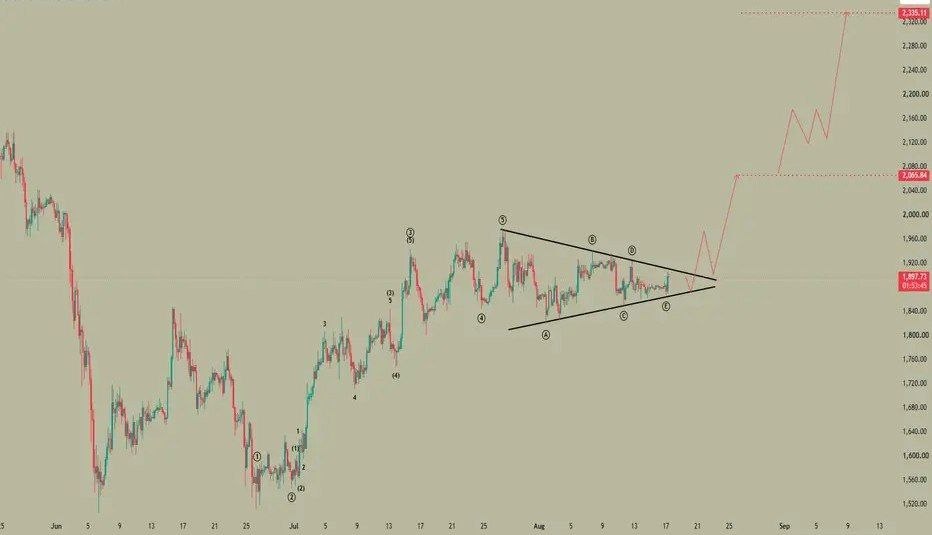
Ethereum (ETH) appears to be forming a triangle pattern, with price approaching a potential breakout point. If the pattern breaks to the upside, the move could represent a Wave 4 or Wave B within the broader market structure.
📈 Bullish Breakout Scenario
A confirmed upside breakout from the triangle could open the way for a potential move toward the $2,100–$2,400 target zone.
Traders should look for a decisive breakout accompanied by strong price confirmation rather than assuming the triangle will automatically break higher.
⚠️ Invalidation Level
A break below $1,865 would invalidate the current bullish triangle-breakout scenario and could indicate that the expected Wave 4 or Wave B structure is no longer valid.
📌 Key Levels
- 📈 Potential Upside Target: $2,100–$2,400
- 🔴 Invalidation Level: $1,865
- 📊 Pattern: Triangle
- 🔄 Potential Structure: Wave 4 or Wave B
💡 Market View
Market View: ETH is approaching a potential triangle breakout. An upside break could support a move toward $2,100–$2,400, while a break below $1,865 would invalidate the current setup.
⚠️ Risk Warning: Chart patterns and technical analysis do not guarantee future price movements. Cryptocurrency markets can be highly volatile. Traders should wait for confirmation and use appropriate risk management before entering a position.
Comments (0)
No comments yet. Be the first to comment.