

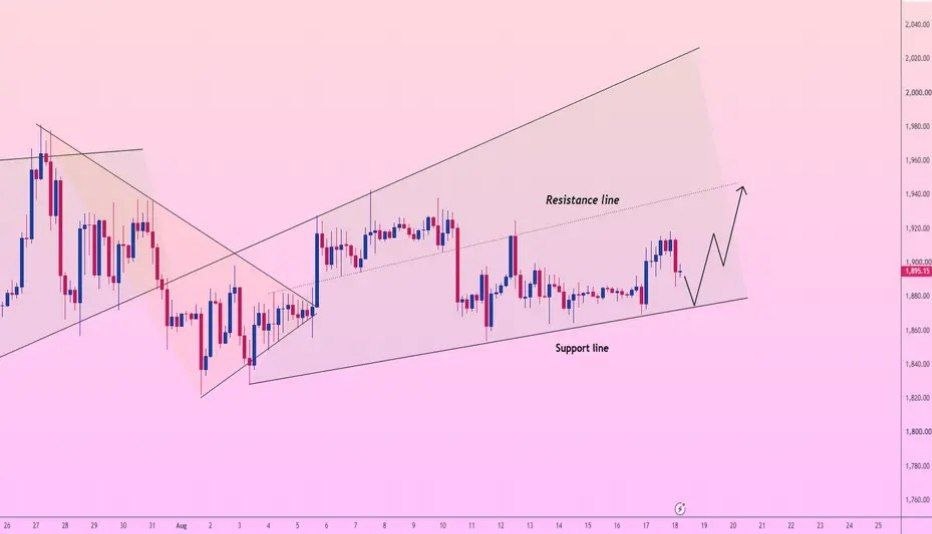
Ethereum (ETH/USD) is testing mid-range support near $1,895.63 while maintaining a bullish structure within an ascending channel on the 4-hour chart. Price is currently pulling back toward the primary support area, where a liquidity sweep and higher-low formation could provide the foundation for another bullish expansion.
📈 Potential Multi-Wave Rebound
The current technical structure suggests a potential multi-wave recovery toward the upper resistance area.
- Wave 1: A localized dip toward the lower support area around $1,870–$1,875 could sweep liquidity and attract buyers.
- Wave 2: A strong rebound could push price toward the $1,920 area.
- Wave 3: A higher-low pullback toward $1,895–$1,900 could establish stronger structural support.
- Wave 4: A final bullish expansion could target the resistance area around $1,945–$1,950.
🧘 Trading Discipline
Technical patience remains important while Ethereum is trading within the established ascending structure. Selling directly into major trendline support can expose traders to the risk of a sharp bullish rebound.
A controlled pullback into the support zone followed by a clear bullish reaction could provide a cleaner setup for traders looking for continuation.
🛠 Trade Parameters
- 🛒 Long Zone: $1,865–$1,885
- 🛑 Stop-Loss Reference: 4H close below $1,840
- 💰 Take-Profit: $1,950
📌 Key Levels
- Current Price: $1,895.63
- Primary Support: $1,870–$1,875
- Structural Retest Zone: $1,895–$1,900
- Intermediate Resistance: $1,920
- Major Resistance / Target: $1,945–$1,950
- Bearish Invalidation: 4H close below $1,840
💡 Market View
Ethereum remains technically constructive while price holds within the ascending channel and above the key support structure. A bullish reaction from the $1,865–$1,885 area could support a recovery toward $1,920, followed by a potential move toward the $1,945–$1,950 resistance zone.
However, a sustained 4-hour close below $1,840 would weaken the bullish setup and indicate that the current ascending structure may be losing strength.
Market View: ETH/USD remains bullish while the ascending structure holds. Traders should watch the $1,865–$1,885 support zone for a potential bullish reaction and $1,945–$1,950 as the main upside target.
⚠️ Risk Warning: Technical analysis and chart patterns do not guarantee future price movements. Cryptocurrency markets are highly volatile. Always use appropriate risk management and wait for confirmation before entering a position.
Comments (0)
No comments yet. Be the first to comment.