

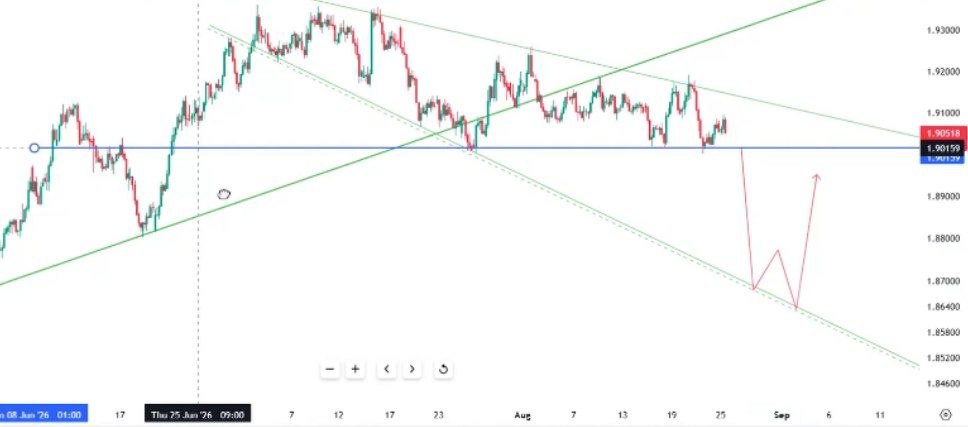
Current Price: 1.9048 – 1.9082
GBPAUD is currently trading inside a tightening compression structure on the 4-hour timeframe. Price is moving between a descending supply trendline and a rising demand trendline, creating a triangle-like formation.
The next confirmed breakout from this structure could determine the short-term directional trend.
🔴 Supply Roof / Resistance
- Descending Red Trendline: Main dynamic resistance.
- 1.9080 – 1.9200: Key horizontal resistance and supply zone.
- 1.9300 – 1.9400: Higher supply zone if bullish momentum accelerates.
🟢 Demand Floor / Support
- 1.9015 – 1.9048: Immediate demand and support zone.
- Rising Green Trendline: Dynamic demand supporting the current structure.
- 1.8700 – 1.8600: Potential lower support area if the current structure breaks.
⚖️ Current Market Bias
Short-Term Bias: Neutral / Compressing
Price remains trapped between the rising demand trendline and descending supply trendline. Neither buyers nor sellers have established decisive control yet.
Because the structure is tightening, traders should focus on the breakout direction rather than trying to predict the next move prematurely.
🟢 Bullish Breakout Scenario
A bullish scenario becomes more constructive if GBPAUD produces a confirmed break and close above the descending red trendline and the 1.9080–1.9200 resistance zone.
A successful breakout could open the way toward:
- Target Zone 1: 1.9300
- Target Zone 2: 1.9400
Traders should ideally look for a strong candle close, follow-through buying, or a successful retest of the broken resistance before considering continuation setups.
🔴 Bearish Breakout Scenario
A bearish setup could develop if price breaks below the rising green trendline and loses the 1.9015 support level.
A confirmed breakdown could expose the following downside areas:
- Target Zone 1: 1.8700
- Target Zone 2: 1.8600
A retest of the broken support or trendline could provide additional confirmation that sellers are gaining control.
🔺 Market Structure
The current GBPAUD 4H structure can be described as a triangle / compression pattern formed by:
- Rising demand from below.
- Descending supply from above.
- Price consolidating between both boundaries.
This compression suggests that the market is approaching a potential decision point. A clean breakout followed by confirmation may provide a clearer short-term directional signal.
📌 Key Levels
- Higher Supply: 1.9300 – 1.9400
- Key Resistance: 1.9080 – 1.9200
- Current Price Area: 1.9048 – 1.9082
- Key Support: 1.9015
- Lower Support: 1.8700 – 1.8600
🎯 Shavyfxhub View
Structure: Triangle / compression between rising demand and descending supply.
Immediate Focus: Wait for a confirmed breakout from the current range.
Critical Resistance: Descending red trendline + 1.9080–1.9200.
Critical Support: Rising green trendline + 1.9015.
Bullish Scenario: Breakout above resistance could target 1.9300–1.9400.
Bearish Scenario: Breakdown below support could target 1.8700–1.8600.
📝 Conclusion
GBPAUD is currently at a key decision point on the 4H timeframe. The market remains neutral while price stays within the compression structure.
The next clean and confirmed break from the rising demand and descending supply boundaries could establish the next short-term trend.
Wait for confirmation. Trade the breakout, not the prediction. 📊
Disclaimer: This content is provided for educational purposes only and does not constitute financial advice. Always conduct your own analysis and apply appropriate risk management before entering any trade.
Comments (0)
No comments yet. Be the first to comment.