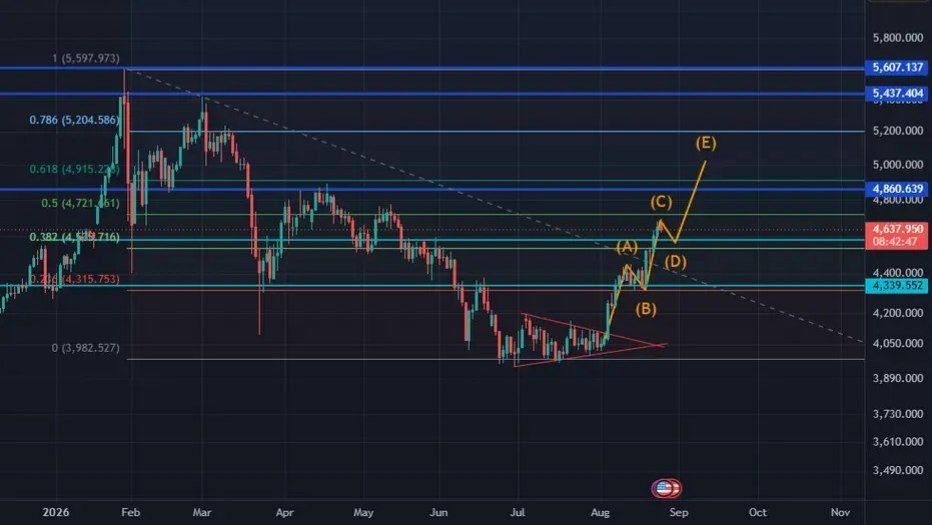
Gold growth and Elliott wave completion
The last wave of gold growth, followed by the start of a 20 to 30 percent correction of the growth amount, and then the start of the next wave of decline in gold.


The last wave of gold growth, followed by the start of a 20 to 30 percent correction of the growth amount, and then the start of the next wave of decline in gold.
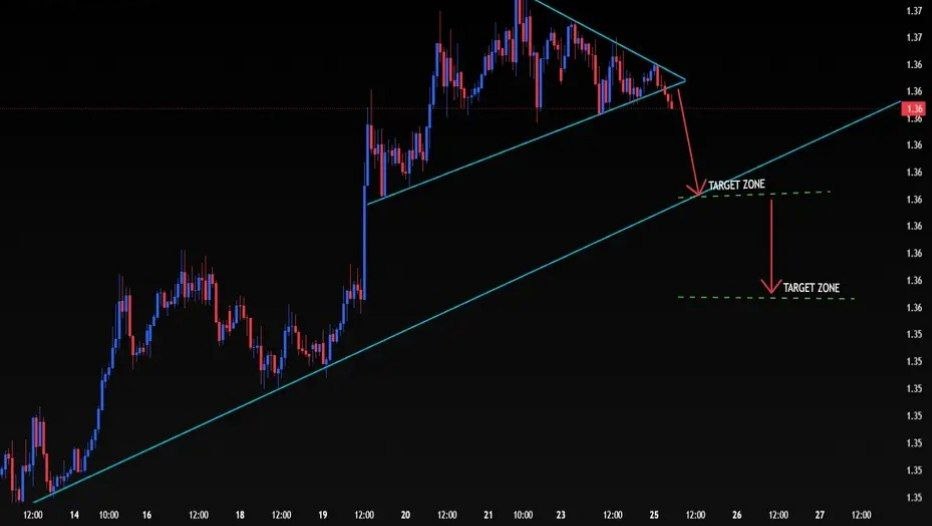
GBPUSD is consolidating inside a contracting triangle structure, with price approaching the lower trendline support. A confirmed bearish breakdown below the triangle can open the way toward the marked downside target zones. 1.3580 is the first key reaction area, while a stronger continuation could extend toward 1.3555–1.3535.
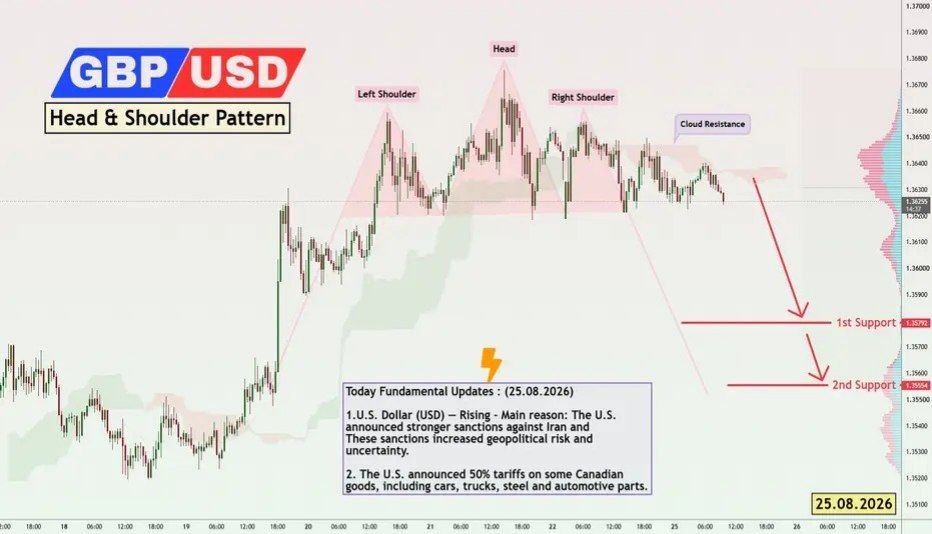
The GBP/USD pair on the m30 timeframe presents a Potential selling Opportunity due to a recent Formation of a Head and Shoulder Pattern. This suggests a shift in momentum towards the downside in the coming hours.
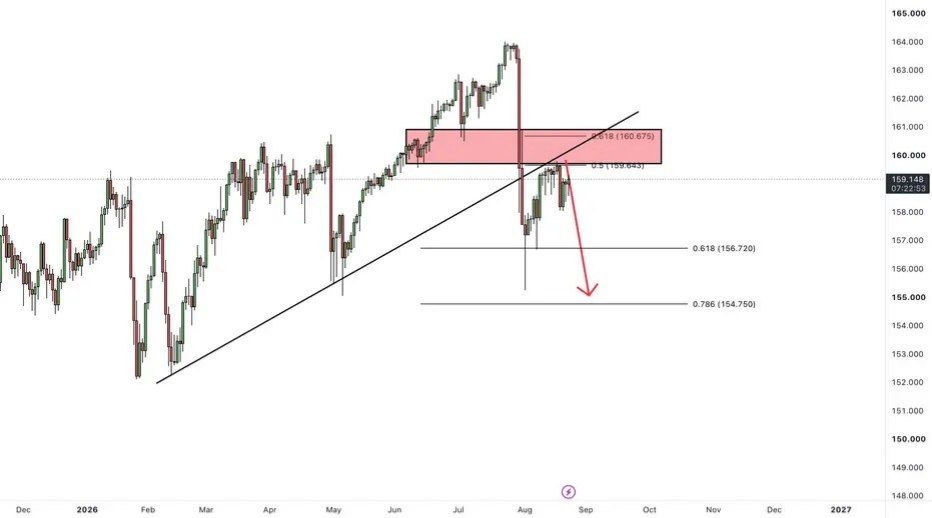
What are your thoughts on USDJPY? Following intervention by the Bank of Japan, USD/JPY experienced a sharp decline from around 164.00 to 155.00, breaking below both the ascending trendline and the key 160.00 support zone.
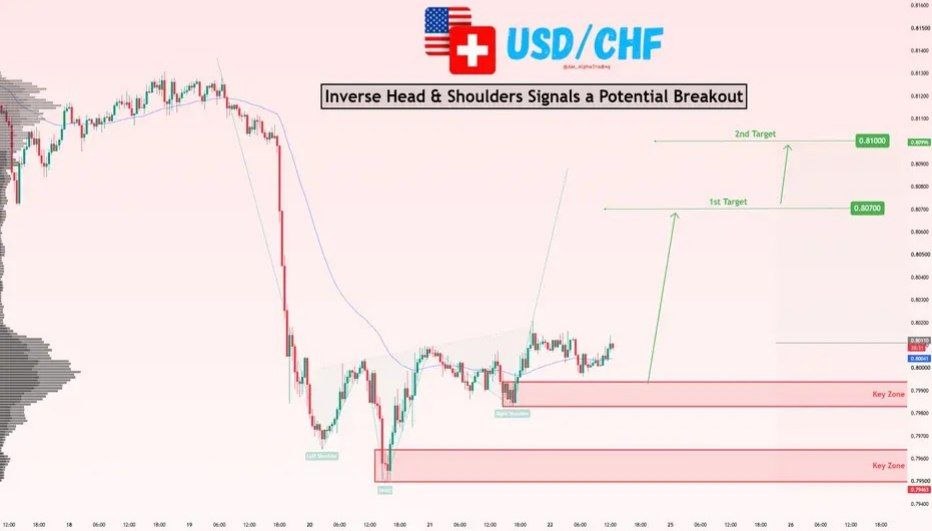
USD/CHF is showing signs of a potential bullish reversal after forming an inverse Head & Shoulders structure around the 0.7950–0.7990 demand area.
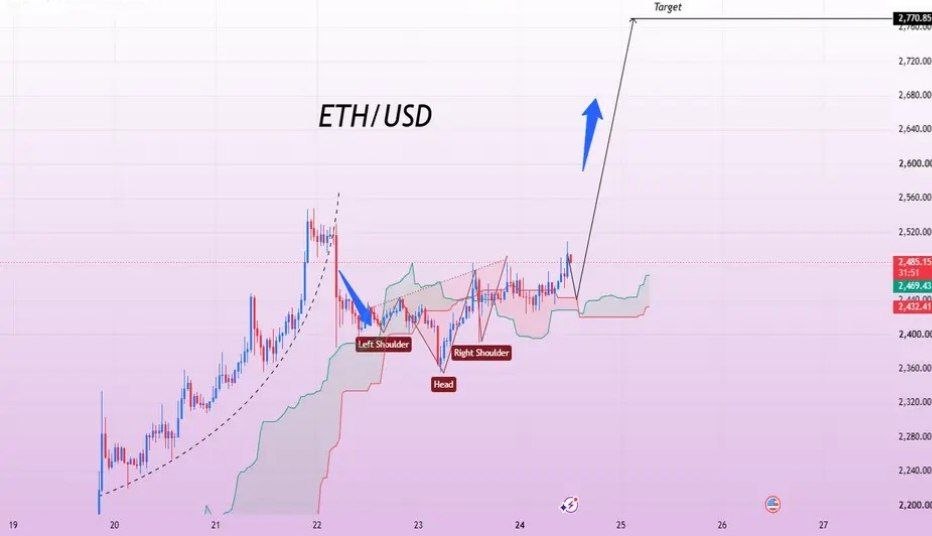
Ethereum is showing a strong bullish structure on the chart, with buyers continuing to defend the recent consolidation area. The Head & Shoulders formation is clearly visible, and price is pushing higher after breaking through the neckline area. 🔥