

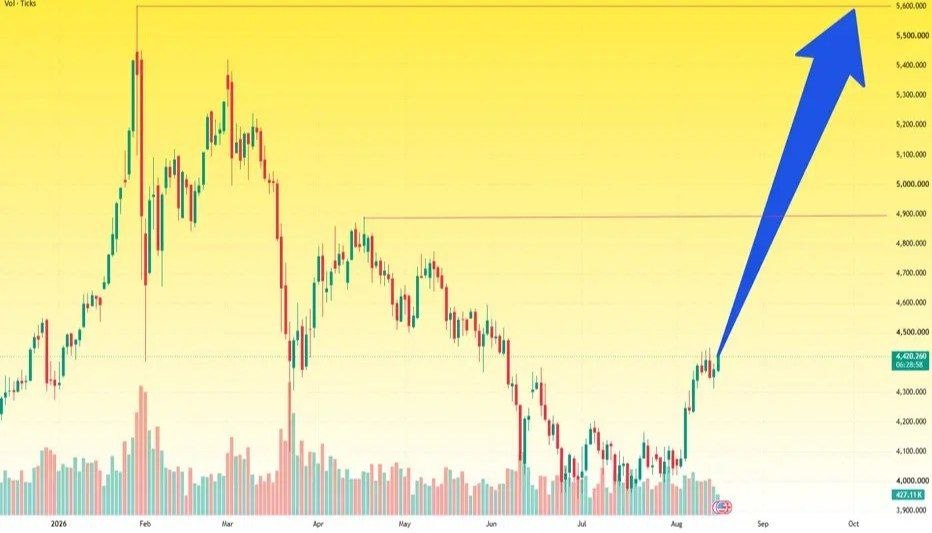
Gold (XAU/USD) on the 15-minute timeframe has shown a clear Market Structure Shift (MSS) following a bullish reversal from low-liquidity levels. Price is currently consolidating near the local resistance zone around 4,410.00, while maintaining an overall bullish bias above the 100 EMA.
Two primary high-confluence scenarios are being monitored for a potential continuation of the bullish move.
🎯 Trading Scenarios
Scenario 1: Pullback to Golden Fibonacci & FVG – Primary Buy Zone
Entry Zone: 4,387.00–4,380.00
📊 Confluence Factors
- Fibonacci: 0.618 / 0.786 Fibonacci Golden Retracement Zone
- Fair Value Gap: Confluence with the 15-minute bullish FVG / Demand Block
- Dynamic Support: 100 EMA around 4,387.52
🛑 Stop-Loss: Below the key swing low around 4,370.00
💰 Take-Profit Targets
- TP1: 4,410.00
- TP2: 4,435.00
Scenario 2: Breakout & Retest Above Resistance – Secondary Buy Zone
Entry Zone: Retest of 4,410.00 following a solid 15-minute candle close above resistance.
📊 Confluence Factors
- Break of Structure (BOS): A clean breakout would confirm bullish momentum.
- Resistance Flip: The previous resistance could become new support after a successful breakout and retest.
🛑 Stop-Loss: Below the breakout candle or consolidation low around 4,395.00
💰 Take-Profit Targets
- TP1: 4,435.00
- TP2: 4,450.00
💡 Technical Reasons & Confluence
📈 Market Structure
The bullish reversal has been confirmed through a Market Structure Shift (MSS), followed by the development of higher highs and higher lows.
🎯 Value Alignment
The 4,387 area aligns closely with the Fibonacci golden retracement zone and the dynamic 100 EMA support, creating an important confluence area for a potential pullback entry.
💧 Liquidity & Imbalance
A bullish Fair Value Gap (FVG) is positioned directly beneath the primary buy zone. This area may provide potential support and liquidity for a continuation move if buyers remain in control.
📌 Key Levels
- 🔴 Resistance: 4,410.00
- 🟢 Primary Buy Zone: 4,387.00–4,380.00
- 🟡 Secondary Entry: Retest of 4,410.00 after confirmed breakout
- 🟢 Swing-Low Invalidation: Around 4,370.00
- 🎯 Upside Targets: 4,435.00–4,450.00
⚠️ Market View
The short-term structure remains bullish while Gold holds above the key support and 100 EMA. Traders can monitor either a pullback into the 4,387–4,380 demand/Fibonacci zone or a confirmed breakout and retest above 4,410.
Market View: No confirmation, no trade. Wait for a clear bullish reaction, MSS/BOS confirmation, or a successful breakout and retest before considering a position.
⚠️ Risk Warning: Technical analysis, Fibonacci levels, EMA indicators, MSS, BOS, and FVGs do not guarantee future price movements. Gold can experience significant volatility, particularly on lower timeframes. Always use appropriate risk management and consider market conditions before entering a trade.
Comments (0)
No comments yet. Be the first to comment.