

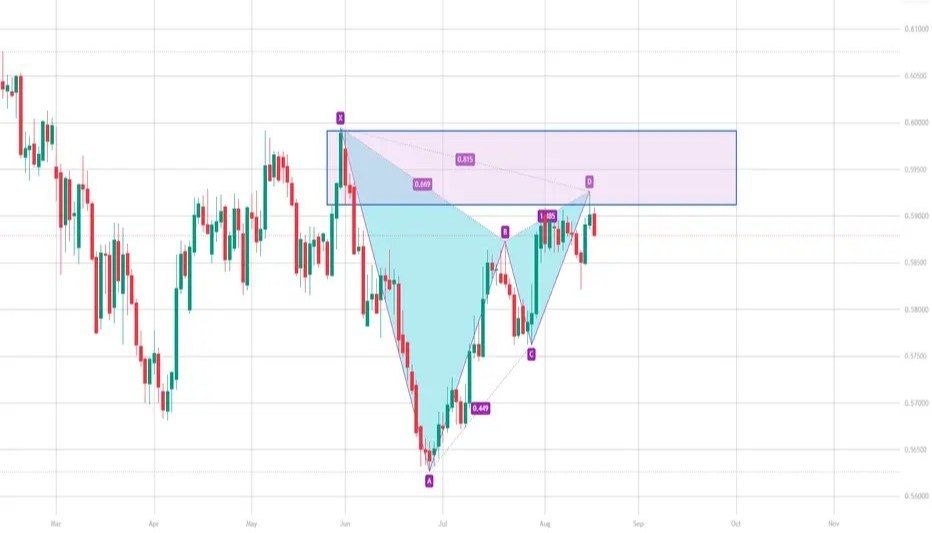
On the daily chart, NZD/USD encountered resistance and moved lower after testing the previous supply zone. The short-term structure has formed a bearish Gartley pattern, suggesting that selling pressure could remain in focus if price fails to reclaim the upper levels.
📉 Key Resistance Zone
The 0.5890–0.5900 area is an important zone to monitor. If NZD/USD rebounds into this region and faces another bearish rejection, it could provide a potential short setup.
Traders should look for clear confirmation, such as bearish price action or a lower-timeframe rejection, rather than entering solely because price reaches the resistance zone.
🎯 Downside Target
If sellers regain control from the 0.5890–0.5900 resistance zone, the next major downside area to watch is around 0.5800.
📌 Key Levels
- 🔴 Resistance / Short Zone: 0.5890–0.5900
- 🟢 Downside Target: 0.5800
- 📊 Pattern: Bearish Gartley
💡 Market View
NZD/USD remains under short-term bearish pressure after rejecting the previous supply zone. A rebound toward 0.5890–0.5900 followed by confirmed bearish rejection could support a move toward 0.5800.
Market View: Watch the 0.5890–0.5900 resistance area closely. A confirmed rejection could favor further downside, while a sustained breakout above this zone would weaken the bearish setup.
⚠️ Risk Warning: Technical patterns do not guarantee future price movements. Traders should wait for confirmation and use appropriate risk management before entering a position.
Comments (0)
No comments yet. Be the first to comment.