

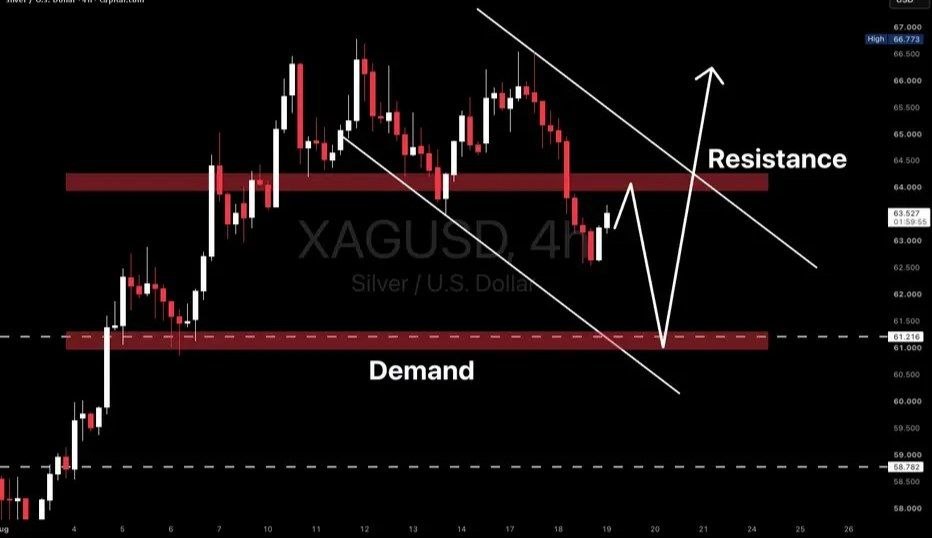
Silver (XAG/USD) is currently trading within an important technical structure on the 4-hour chart. Price has been forming lower highs and lower lows since the mid-August peak near $67.00, creating a descending channel.
Two major zones are currently important for the next directional move: the $64.00–$64.50 resistance zone and the $61.00–$61.50 demand zone. Traders should watch how price reacts around these areas before considering a potential continuation or reversal.
📊 Key Levels to Watch
- Resistance Zone: $64.00–$64.50
- Demand Zone: $61.00–$61.50
- Major Previous High: Around $67.00
- Market Structure: Descending channel with lower highs and lower lows
📉 Scenario 1 – Retest and Reject: Bearish Continuation
Silver remains inside a descending channel, suggesting that sellers still have short-term control. If price continues to respect the upper boundary of the channel and fails to reclaim the $64.00–$64.50 resistance zone, another leg lower could develop.
The technical path could lead Silver toward the $61.00–$61.50 demand zone, where buyers may attempt to defend the market.
The $61 area is particularly important because it combines a previous demand region with a major psychological round-number level.
Potential Market View: Silver could experience another downside move toward $61 before attempting a meaningful recovery.
📈 Scenario 2 – Demand Zone Reaction: Bullish Reversal
If Silver reaches the $61.00–$61.50 demand zone and buyers step in aggressively, the area could become the foundation for a potential bullish reversal.
However, traders should avoid blindly buying simply because price reaches a demand zone. Confirmation is important.
🔎 Confirmation Signals to Watch
- Bullish engulfing candle: A strong bullish candle that absorbs the previous bearish candle.
- Rejection wick: A long lower wick showing that sellers were unable to maintain lower prices.
- Volume expansion: Increasing volume during the bullish reaction can provide additional confirmation.
- Market Structure Shift: A break of a nearby lower high can provide evidence that short-term momentum is changing.
- Higher-low formation: A successful retest after the initial bounce can strengthen the reversal setup.
🚀 Scenario 3 – Breakout Above Resistance
A more convincing bullish scenario would develop if Silver breaks above the $64.00–$64.50 resistance zone while simultaneously breaking the descending trendline.
A breakout through both horizontal resistance and descending trendline resistance would provide stronger technical confluence than a breakout through only one level.
Traders should ideally wait for a confirmed breakout and consider whether price can hold above the former resistance rather than entering immediately after a short-lived spike.
📌 Breakout Confirmation
- Strong candle close above $64.50
- Breakout of the descending trendline
- Follow-through buying after the breakout
- Successful retest of the former resistance as support
If these conditions occur, the bearish channel structure would begin to weaken and the probability of a broader recovery could increase.
🛡️ Scenario 4 – Risk Management
This setup also provides a useful example of how traders can approach risk management around technical zones.
Rather than focusing only on the potential profit target, traders should first determine where the technical setup becomes invalid.
- Long positions: Risk can be considered below the demand zone, depending on the trader's strategy and timeframe.
- Short positions: Risk can be considered above the resistance zone if the bearish rejection setup remains valid.
- Position sizing: The distance between entry and invalidation should be considered before determining trade size.
- Risk-to-reward: Potential reward should be evaluated against the amount being risked.
Position sizing should be based on the amount of capital a trader is willing to risk, rather than simply choosing a fixed lot size for every trade.
💡 Silver Market Outlook
Silver remains at an important decision point. The $64.00–$64.50 resistance zone represents a key area for sellers, while $61.00–$61.50 is the major demand zone to watch for a potential bullish reaction.
As long as Silver remains inside the descending channel, another move toward the lower demand zone remains possible. However, a confirmed reaction from $61 could create the foundation for a bullish reversal.
Alternatively, a strong breakout above $64.50 combined with a break of the descending trendline would significantly improve the bullish outlook.
Key Takeaway: Watch $61.00–$61.50 for a confirmed demand reaction and $64.00–$64.50 for a potential breakout. Patience, confirmation, and disciplined position sizing are more important than blindly entering at a predefined price level.
⚠️ Risk Warning
Technical analysis and chart patterns do not guarantee future price movements. Silver can experience significant volatility, especially around economic data, central-bank decisions, geopolitical events, and changes in the U.S. Dollar. This content is for informational and educational purposes only and should not be considered financial advice.
Comments (0)
No comments yet. Be the first to comment.