

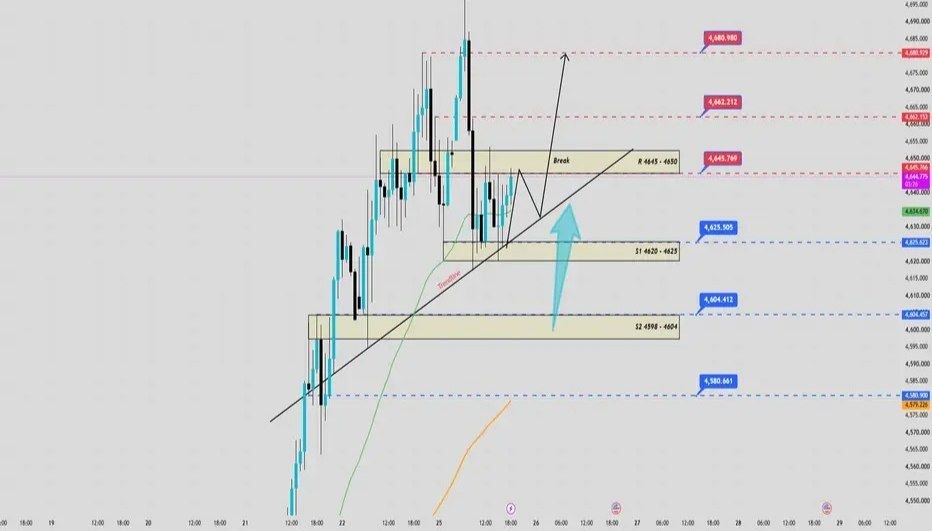
Gold continues to maintain its bullish trend as price remains above key support levels and continues to trade above the rising H1 trendline. The EMA structure also remains bullish, with EMA34 above EMA89. Currently, price is consolidating above the S1 support zone (4620–4625).
VIEW TRADE
- Price has repeatedly rejected breaks below the S1 support zone (4620–4625), with buying pressure returning each time. Price is also forming a rising H1 trendline, supporting the current bullish structure.
- If price rejects a breakdown and buying pressure returns, a continuation BUY setup can be considered, targeting R (4645–4650). Since price is currently consolidating within a narrow range, safer trading would be to wait for a confirmed breakout above R (4645–4650) before entering a BUY.
- If the H1 candle confirms a complete breakout above R (4645–4650), a continuation BUY setup becomes valid, targeting the 466x–468x zone.
- Bullish momentum is expected to strengthen significantly if price breaks the recent high around 469x–470x. However, if price continues to reject the breakout and selling pressure returns, Gold may experience a pullback of approximately 20–30 points.
- If price consolidates and completely breaks below S1 (4620–4625) while also breaking the H1 rising trendline, do not rush to BUY again. Wait for price to react around the S2 support zone (4598–4604).
- If price rejects the breakdown at S2 (4598–4604) and buying pressure returns, prioritize a BUY setup targeting S1 (4620–4625) and then R (4645–4650).
- Selling pressure will regain control if price breaks and closes below the S2 support zone (4598–4604).
Key Levels
- Resistance (R): 4645–4650
- Recent High: 469x–470x
- Support (S1): 4620–4625
- Support (S2): 4598–4604
- EMA Structure: EMA34 above EMA89
- Trend: Bullish
Trading Outlook
The overall H1 structure remains bullish while Gold holds above the S1 support zone and the rising trendline. Traders should monitor the reaction around 4620–4625 and wait for confirmation before entering a position. A confirmed breakout above 4645–4650 could support further bullish continuation, while a confirmed breakdown below 4598–4604 would indicate increasing selling pressure.
Risk Warning: This analysis is for educational and informational purposes only. Always use proper risk management and confirm price action before entering a trade.
Comments (0)
No comments yet. Be the first to comment.