

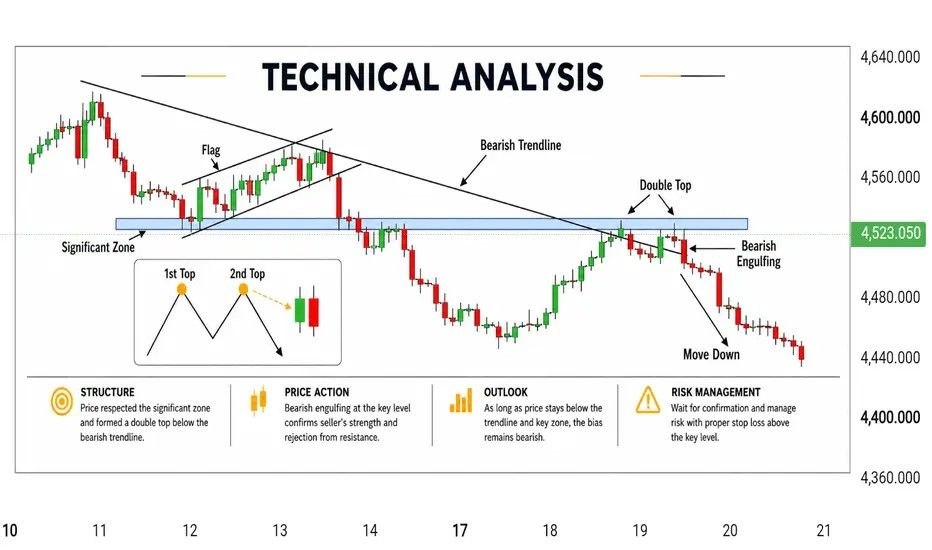
This educational analysis explains how a potential bearish reversal can develop when price reacts to a significant resistance zone. Rather than relying on a single indicator or candlestick pattern, the setup combines multiple technical concepts to help traders understand the broader market structure.
📊 Key Technical Concepts
1. Significant Resistance Zone
Price has previously reacted around an important horizontal area, making it a significant zone to monitor. When price returns to a level where strong selling pressure appeared in the past, traders often watch closely to determine whether the area will act as resistance again.
2. Bearish Trendline
The descending trendline represents the broader bearish market structure and can act as dynamic resistance. As long as price continues to respect this trendline, sellers may remain in control of the overall structure.
3. Double-Top Formation
A potential double top can develop when price tests a similar resistance area twice but fails to establish a sustained breakout above it.
This pattern may indicate that buying momentum is weakening around the resistance zone. However, a double top should not automatically be considered a confirmed reversal until additional price-action confirmation is present.
4. Bearish Engulfing Candle
A bearish engulfing candle forming near a significant resistance zone can indicate increasing selling pressure. This pattern becomes more meaningful when it appears in an area where price has previously faced rejection.
The combination of resistance, a bearish trendline, and a bearish engulfing pattern can provide additional confluence for studying a potential downside reversal.
5. Waiting for Confirmation
Rather than assuming that price will reverse immediately, traders can wait for additional confirmation before considering the bearish scenario.
Possible confirmation signals may include:
- A break below a relevant support level.
- A break in the existing bullish market structure.
- Formation of lower highs and lower lows.
- Continued bearish momentum following the rejection.
- A successful retest of a broken support level as new resistance.
Waiting for confirmation can help reduce the risk of entering a trade based only on an initial rejection.
🧩 Why Confluence Matters
An individual candlestick pattern may not provide enough information on its own. However, when multiple technical factors point toward the same potential outcome, the setup may become more meaningful.
In this example, traders can study the combination of:
- 📍 A significant resistance zone
- 📉 A descending bearish trendline
- 🔄 A potential double-top structure
- 🔴 A bearish engulfing candle
- ✅ Additional market structure confirmation
🛡️ Risk Management
Risk management remains essential when analyzing any potential reversal setup. Before taking market exposure, traders should define the point at which their analysis would no longer be valid.
The invalidation area should generally be based on the market structure. For example, if price breaks and sustains above the resistance structure that supports the bearish idea, the original bearish interpretation may no longer be valid.
Before entering any trade, traders should consider:
- Where the setup becomes invalid.
- The appropriate stop-loss location based on market structure.
- Position size based on the amount of capital they are willing to risk.
- The potential risk-to-reward ratio.
💡 Educational Takeaway
The key lesson is that individual candlestick patterns become more meaningful when they appear at technically important areas and align with the broader market structure.
A potential double top combined with resistance rejection, a bearish trendline, and bearish price action can provide a useful framework for studying possible market reversals. However, confirmation and proper risk management remain essential.
Remember: Do not rely on a single signal. Look for confluence between market structure, key levels, trend direction, price action, and risk management before making a trading decision.
⚠️ Disclaimer
This content is provided for educational and informational purposes only. It is not a buy or sell signal, investment advice, or a guarantee of future market performance. Market conditions can change rapidly, and every trading setup requires independent analysis and appropriate risk management.
Comments (0)
No comments yet. Be the first to comment.