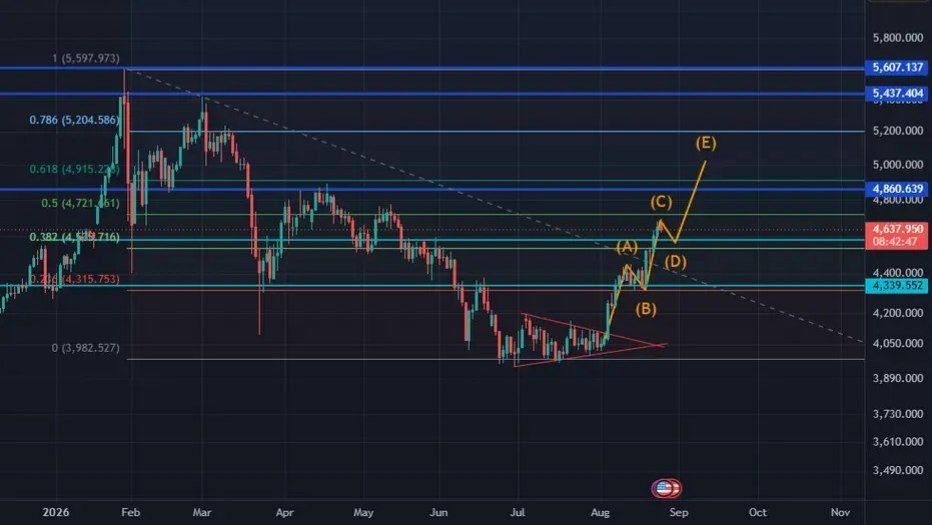
Gold growth and Elliott wave completion
The last wave of gold growth, followed by the start of a 20 to 30 percent correction of the growth amount, and then the start of the next wave of decline in gold.


The last wave of gold growth, followed by the start of a 20 to 30 percent correction of the growth amount, and then the start of the next wave of decline in gold.
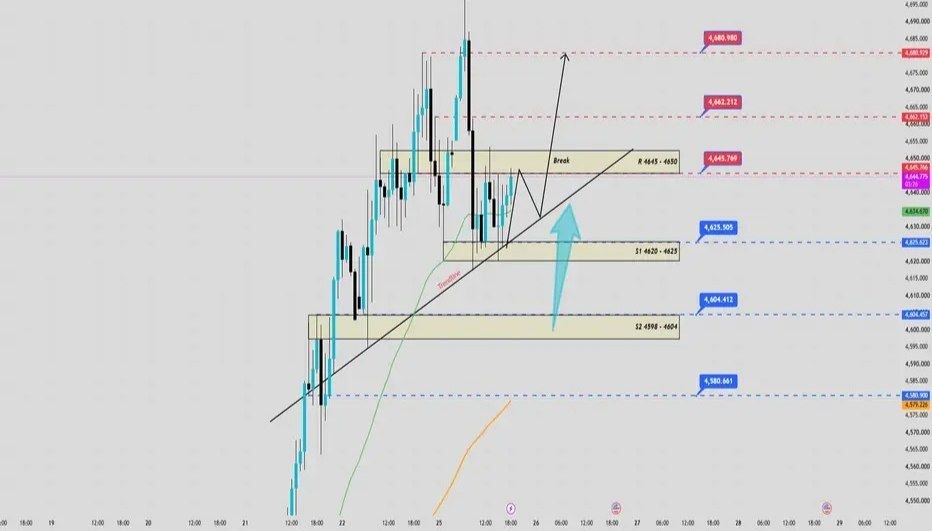
Gold continues to maintain its bullish trend as price remains above key support levels and continues to trade above the rising trendline. The EMA structure also remains bullish, with EMA34 above EMA89. Currently, price is consolidating above the S1 support zone (4620–4625).
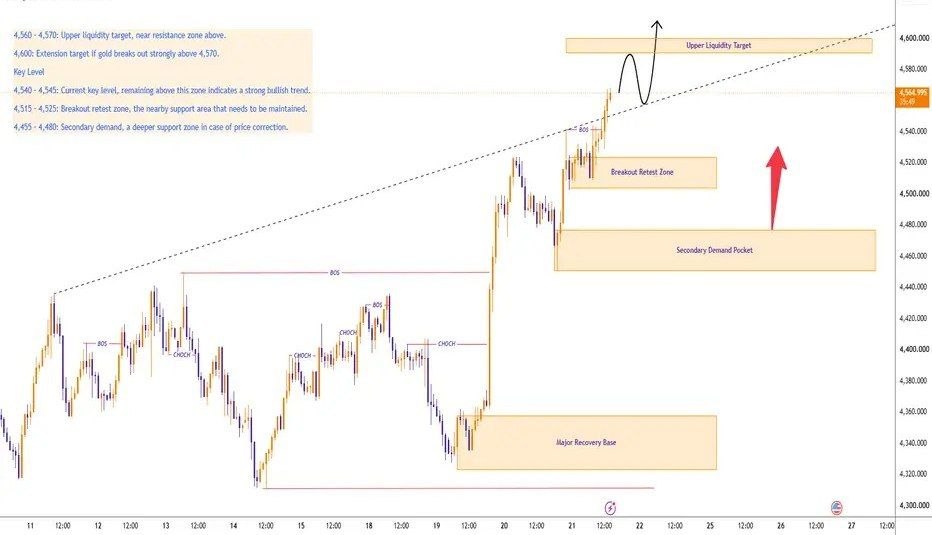
Gold is trading around 4,565 after extending its bullish recovery, supported by continued US Dollar weakness and rising concerns over US debt. This improves gold’s safe-haven appeal and keeps buyers active near the highs.
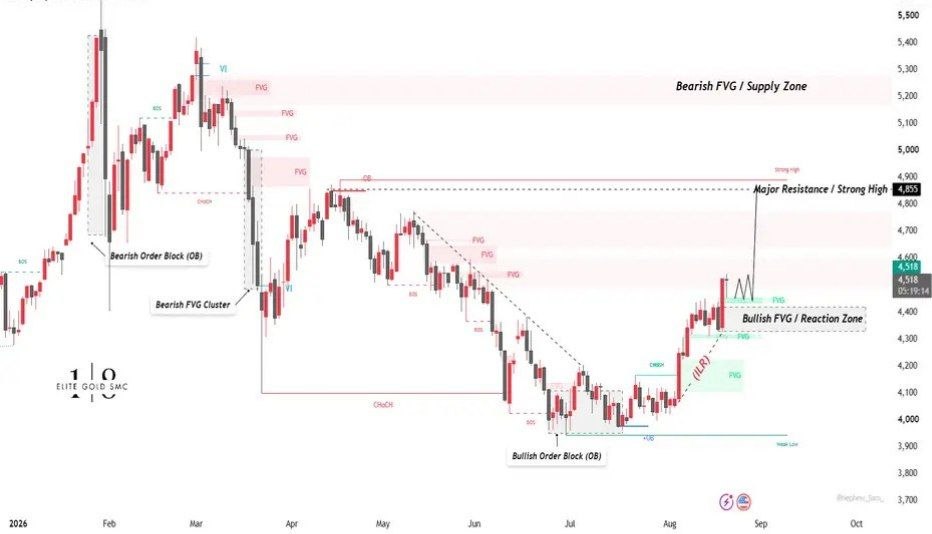
This XAUUSD 4H analysis focuses on market structure, liquidity, and key FVG reaction zones. The 4100–4300 area represents an important internal liquidity and reaction range, while the marked supply and demand zones highlight potential areas where price may respond. The analysis follows an SMC approach: identify liquidity, monitor structure, wait for a sweep or displacement, and seek BOS/CHoCH confirmation before considering an entry.
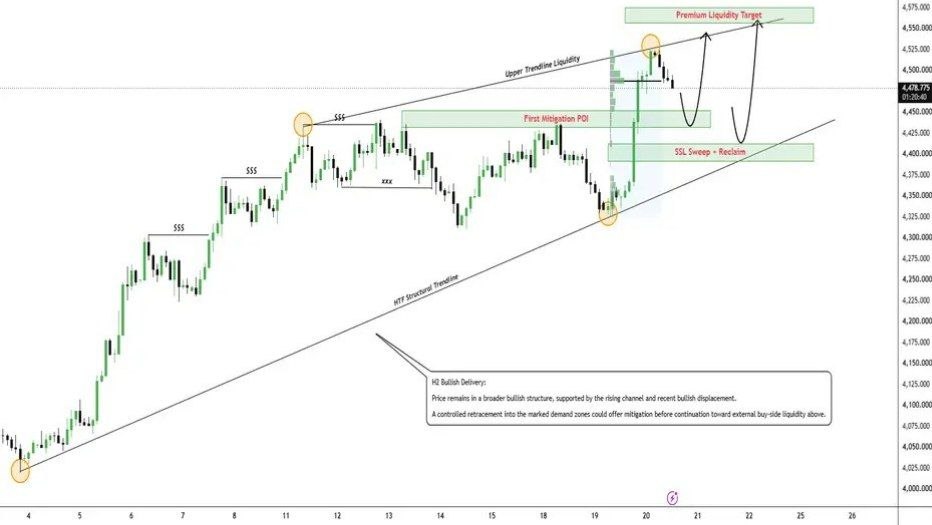
Gold remains supported after the latest Fed minutes kept the policy tone cautious, while the U.S. Treasury’s decision to increase long-end liquidity support buybacks has helped keep yields and the dollar softer. That backdrop continues to favor precious metals and supports buying interest on controlled pullbacks rather than aggressive chasing at highs.
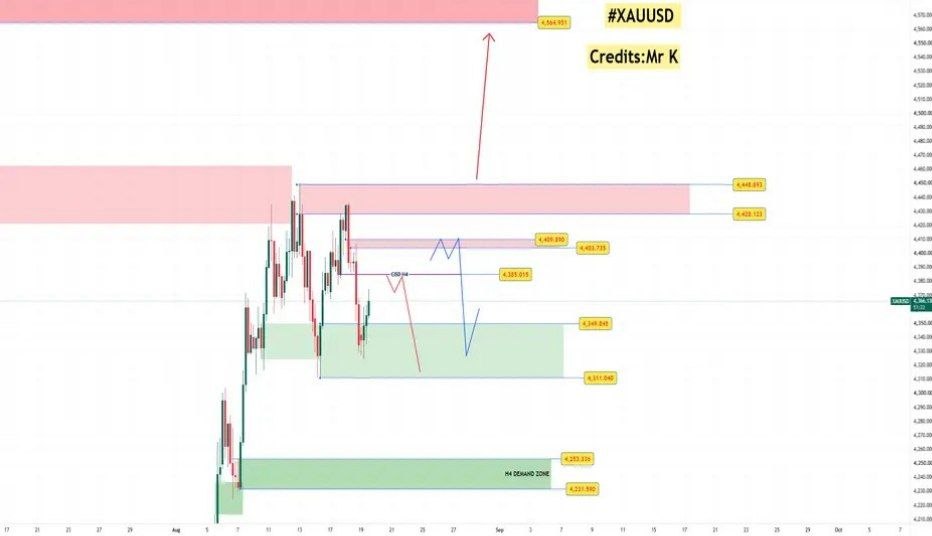
As per our anticipation, Gold has delivered the expected move from our marked H4 FVG around 4403–4410. 🎯