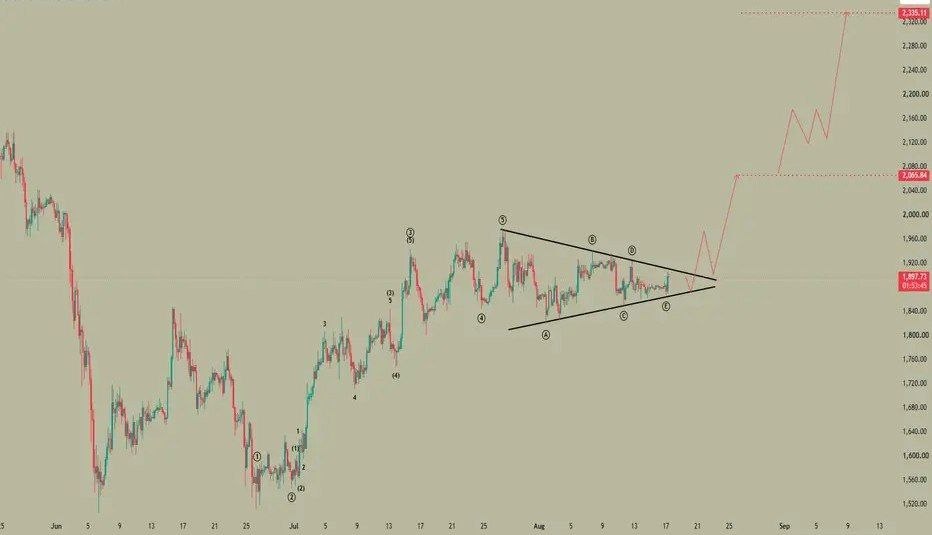
ETH Triangle?
ETH looks like a triangle is about to break out which could be Wave 4 or Wave B, I would expect a move to $2100 - $2400 if it breaks to the upside.


ETH looks like a triangle is about to break out which could be Wave 4 or Wave B, I would expect a move to $2100 - $2400 if it breaks to the upside.
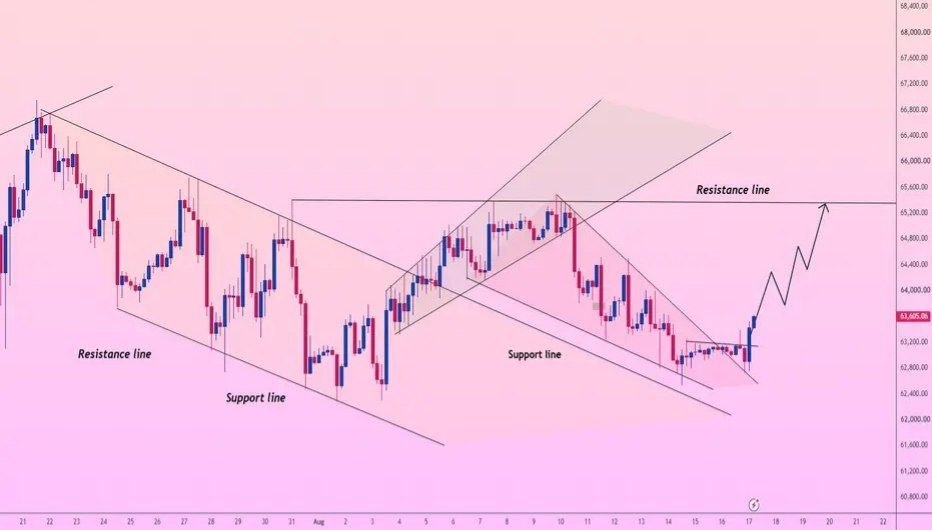
Holding firm above local breakout support at 63,577.69! Are you panic-selling this move, or locked in for the multi-wave rally to horizontal resistance? 🤔
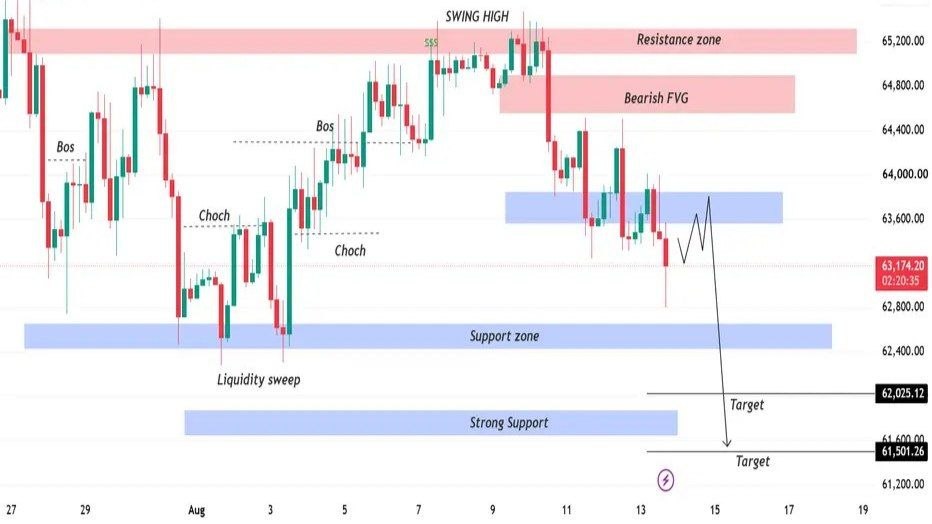
Bitcoin is currently trading around the 63,200 area and sitting at an important decision point. The chart shows a short-term bearish correction after price was rejected from the 65,200–65,300 resistance zone. Sellers have taken control in the near term, while buyers are attempting to defend the 63,500–63,800 area and prevent a deeper correction.
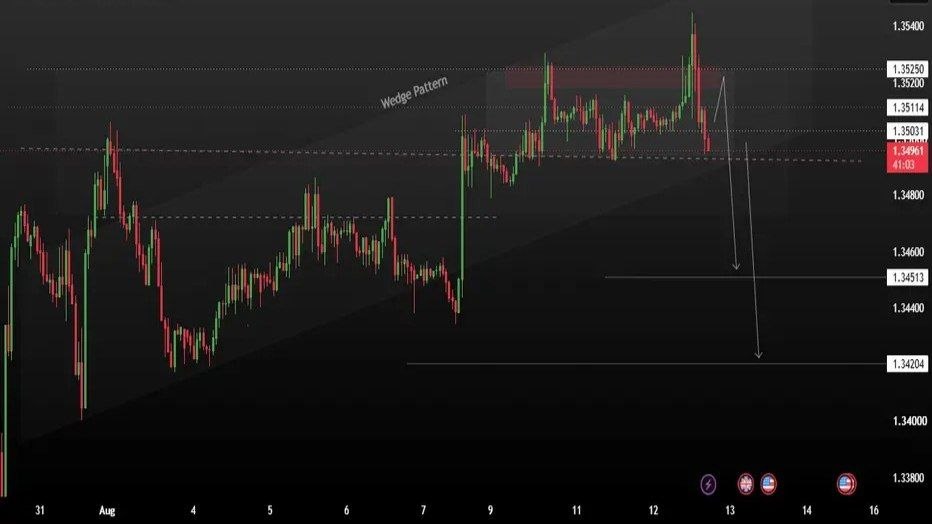
GBP/USD is showing increasing short-term selling pressure after repeatedly failing to sustain a move above the 1.3520–1.3525 resistance zone. Price pushed higher into this supply area but faced strong rejection, leaving a clear sign that sellers are still defending the upper levels.
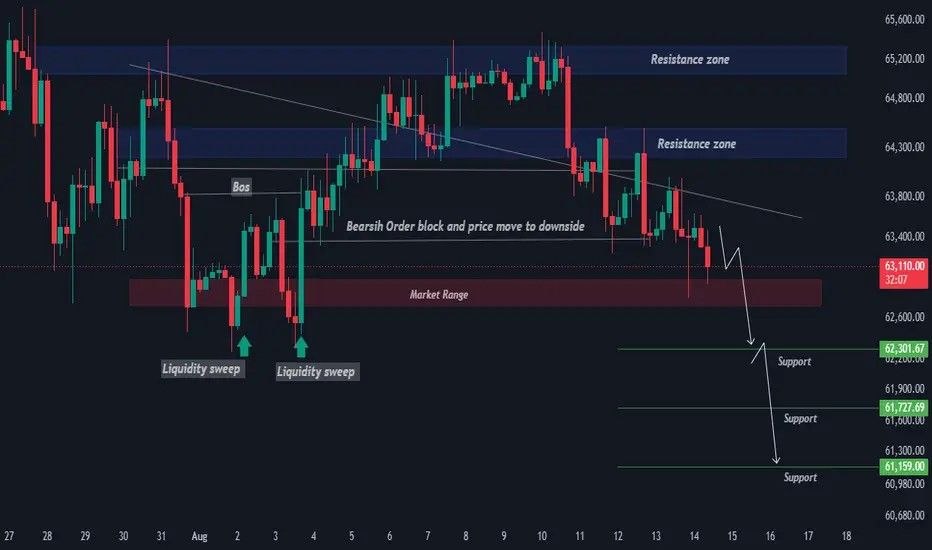
BTCUSD – H4 has rejected the major resistance zone and is showing clear signs of weakening bullish momentum. Price is currently trading around 63,088, below the nearby resistance area, while the bearish order block and descending structure suggest sellers are gaining control.

Introduction: Financial markets are set for a potentially active trading session as key US economic indicators are scheduled for release on Friday, August 14, 2026. The US Retail Sales, Retail Sales Control Group, and Michigan Consumer Sentiment Index could provide important signals about consumer spending and economic confidence. Traders will be closely watching these releases for potential impacts on the US Dollar, major currency pairs, Gold, and Silver.